
Analyzing sales data in Phyton can be simple, and in this article, we will share some insights that can help you on this journey.
Firstly, it is necessary to understand that solid knowledge of the Python language is needed to create more advanced models.
However, it is possible to start analyzing sales data using more straightforward commands and functions. For this, we can count on the support of educational communities and even Artificial Intelligence.
In the commercial context, as important as programming knowledge is the professional’s experience analyzing the information and understanding how it will facilitate the work and enhance its results.
We will start by understanding how Artificial Intelligence can be your ally in creating the necessary codes, and then we will get to know the Head and Describe functions.
Before starting, we invite you to sign up for our Newsletter and visit our YouTube Channel, where we share a free Exploratory Sales Data Analysis course.
Analyze commercial data in Python with the help of Artificial Intelligence
Firstly, we need to understand that some commercial analyses and model creation will require a lot of Data Science and Engineering knowledge.
However, for more straightforward, everyday applications, we can use Phyton with just a few commands and rely on the help of its powerful libraries.
Furthermore, we found several tools to help us develop the codes for exploratory data analysis, such as online courses and Artificial Intelligence.
For example, in the image below, we present a code request for Colab AI, the code provided, and the result.
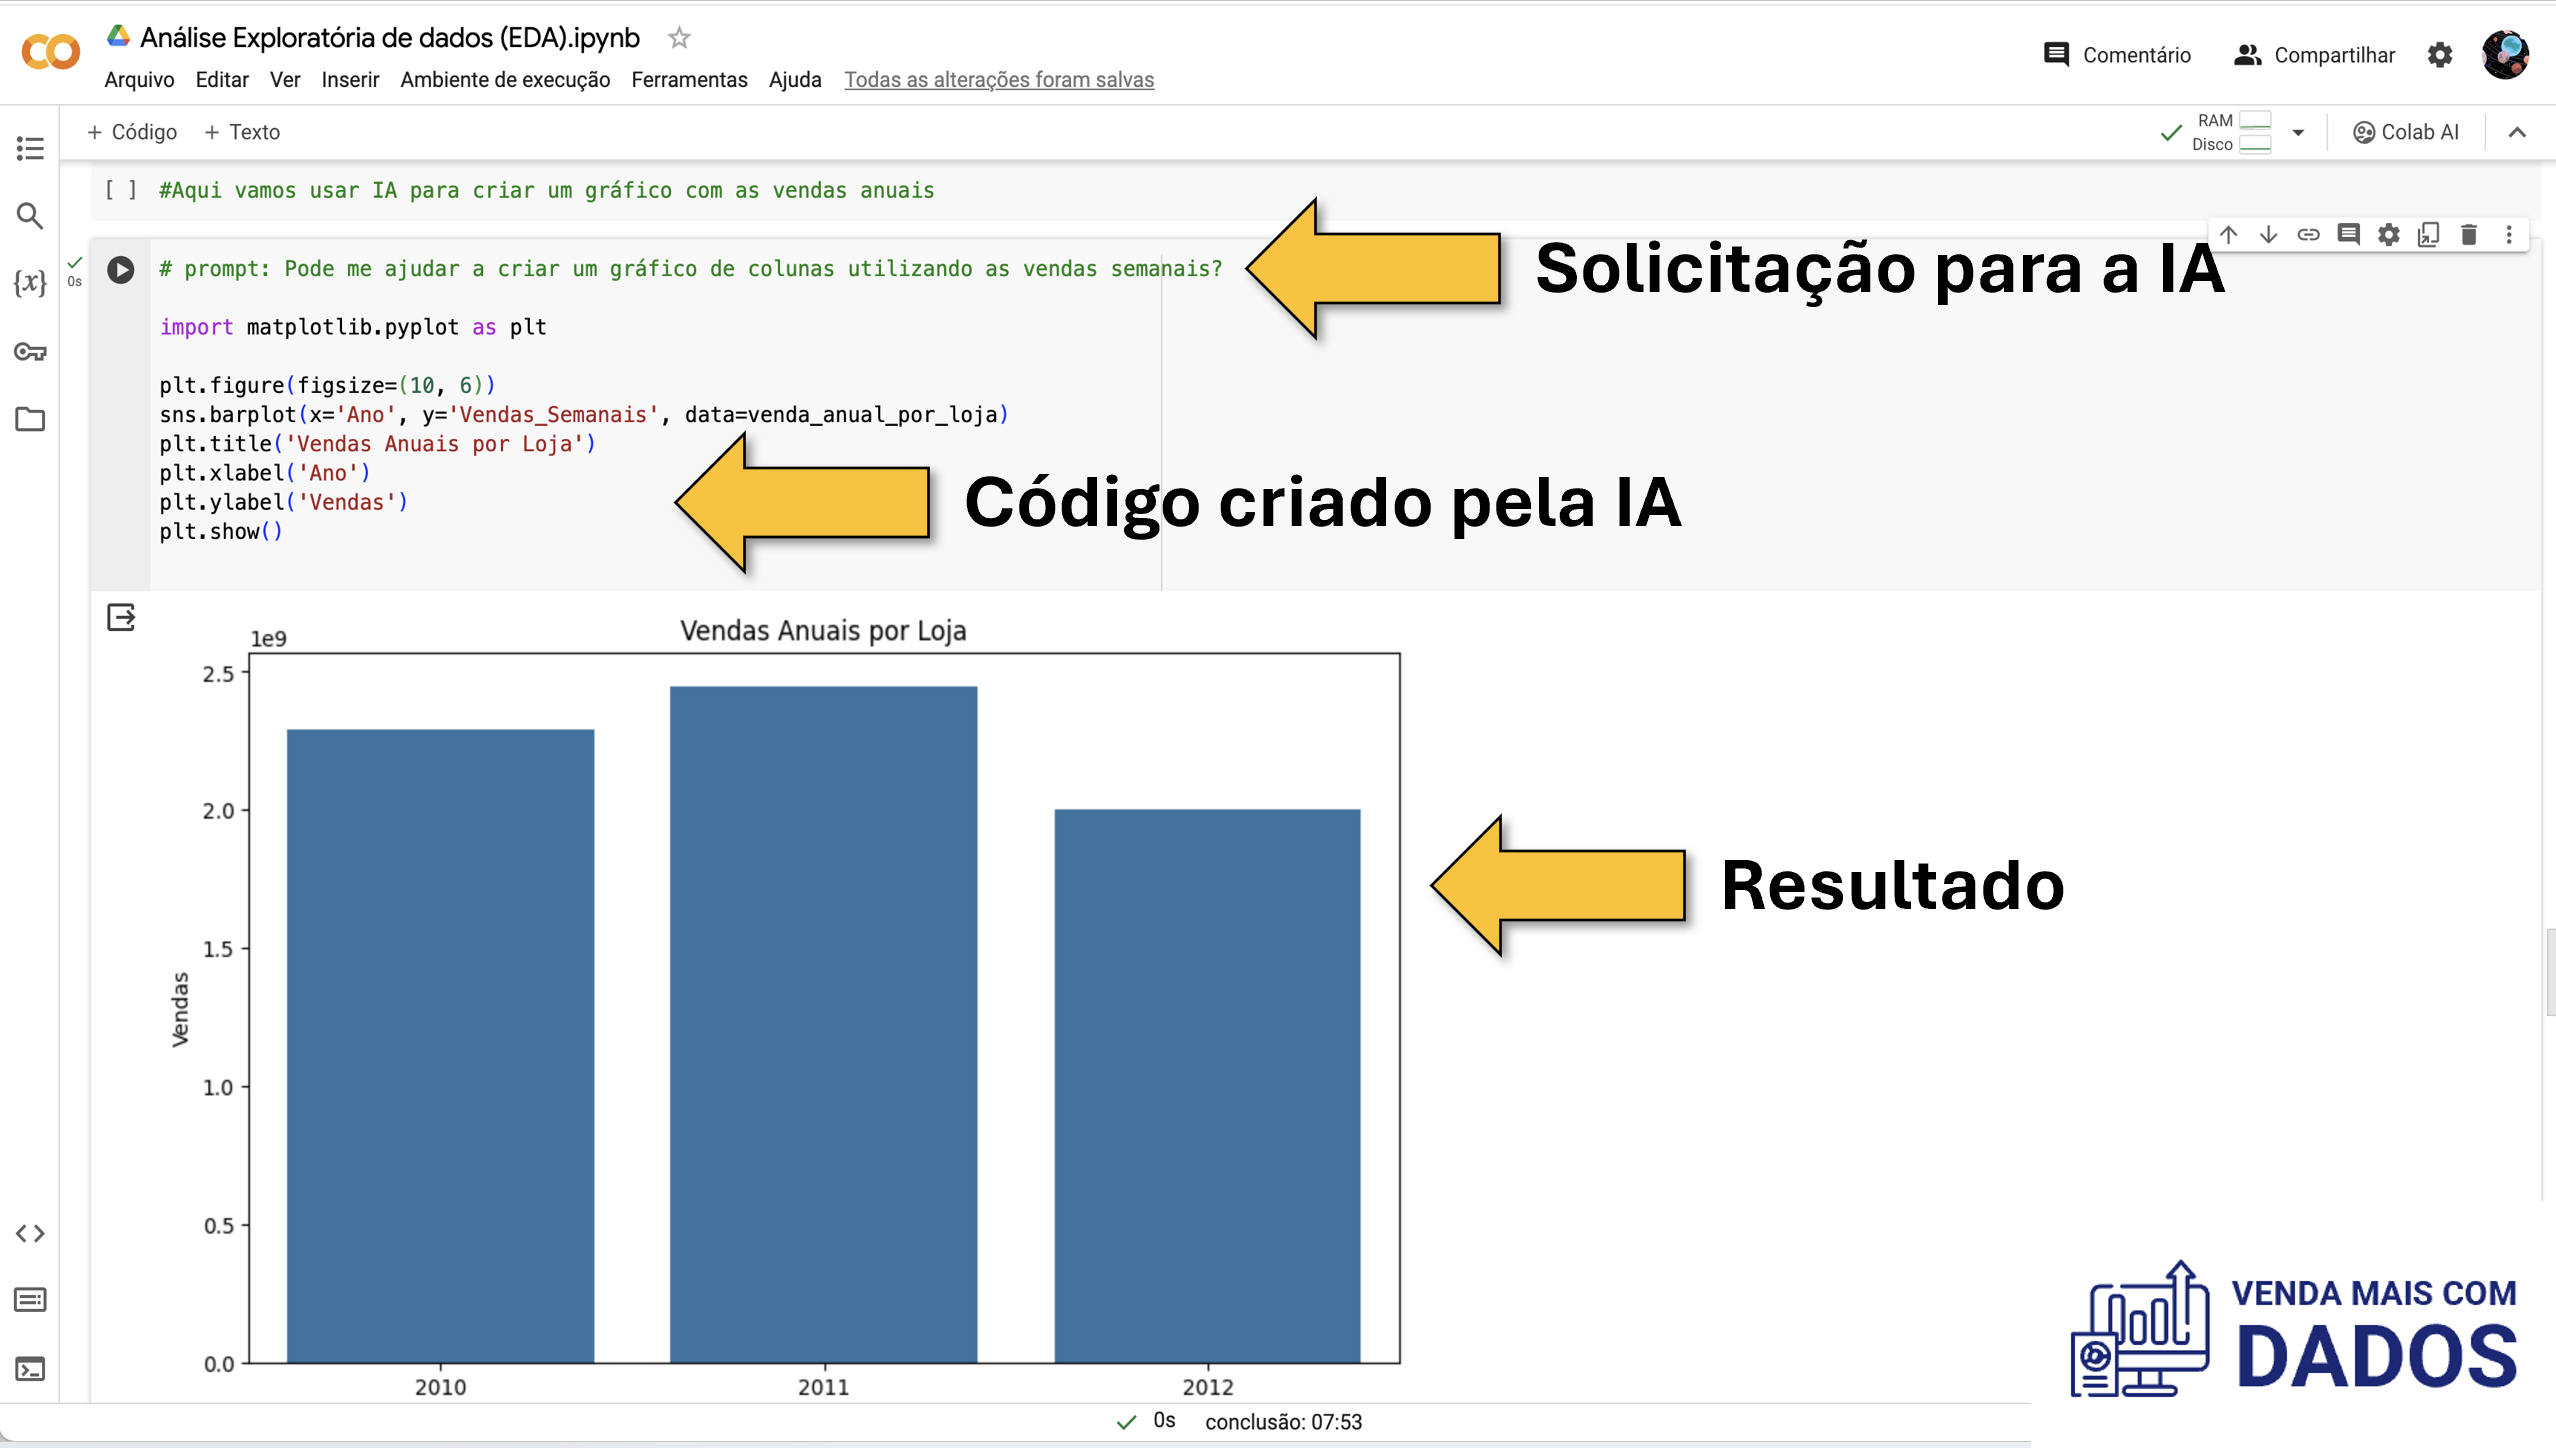
Colab AI assistance in creating codes in Python
In the comments, have you ever used AI to create codes? What did you think of the experience?
Knowing your database is essential.
Now that we know that creating programming codes in Python will not be our problem, let’s learn about some commands that can help us analyze commercial data directly in our browser.
In our article Phyton in Sales Data Analysis – 3 Super Tips, we present 3 fundamental Phyton libraries for data analysis, they are:
- Pandas
- Seaborn
- Matplolib
Therefore, from the Pandas library, we used two exciting functions for the initial analysis of our database.
Firstly, we use the Head function in data analysis, which is one of the most used functions.
This function allows us to view the first five lines of our database and thus have a good idea of what the variables present and their characteristics.
See the image below from our Exploratory Sales Data Analysis course in Phyton, which is accessible on our YouTube channel.
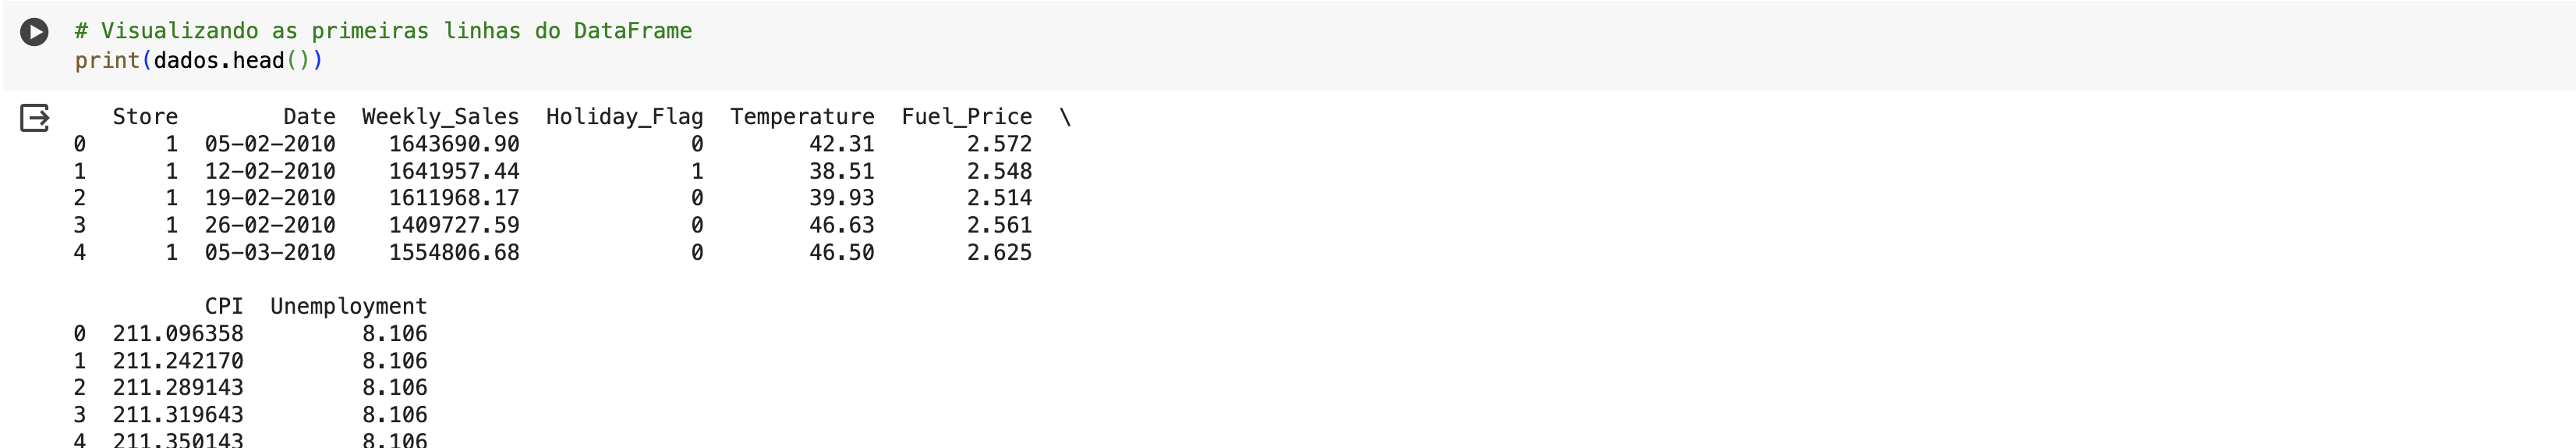
Head function result
For example, the image above shows us that we have 8 variables, their dimensions, and the first five values of each one.
Statistical analysis with just a few commands
Once you have started analyzing your database using the Head function in the Pandas package, you are ready to take more advanced steps.
For this, we will use another function from the Pandas package to obtain a descriptive statistical analysis of our base.
Thus, with a single command, it is possible to obtain, for each of the variables:
- Score
- Average
- Standard deviation
- Minimum value
- 1, 2, 3 quartiles
- Maximum value
This is the Describe function, and below we have an example of the function applied in our database.
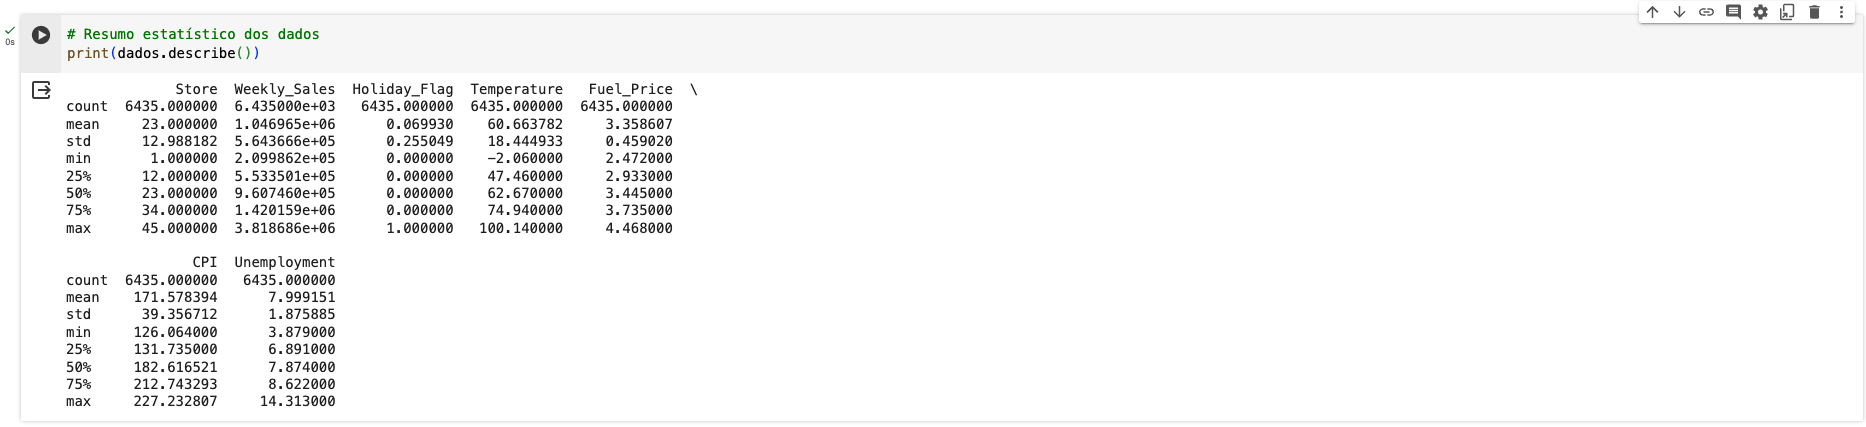
Descriptive Statistics obtained from the describe function
Conclusion
Python is a very versatile programming language and can help us quickly obtain various business insights.
It is expected to think that we are not capable of analyzing sales data in Phyton.
However, as we saw in this post, simple functions help us quickly understand the database, and for more complex cases, we can count on the help of Artificial Intelligence and user communities.
You can find content like this in our Data Science Skills database, where we have collected articles about Phyton, R and Excel.
Another important source of knowledge is our YouTube Channel, where we have put together some courses, as well as free courses and quick videos with insights that we obtain by analyzing some articles in the area or participating in exclusive events.
You can support our blog by following our Channel, our social networks and subscribing to our newsletter.
It is also possible to purchase one of our courses on Udemy, where we present more advanced use cases for these tools.
A big hug, and have a great week.
0 comentários