
Maximize your sales through data visualization is the topic of this new article on our blog.
Acesse aqui a versão em português deste artigo
The objective is to present 3 essential graphs that every salesperson, experienced or beginner, should know.
In addition to presenting the resources, we will help you understand what type of insights can be gained and each one of them.
We will discuss Trend Charts, Customer Segmentation, and the Sales Funnel.
Maximize your sales with graphical trend analysis.
Trend graphs can be a strong ally in your sales forecasting processes and help you sell more.
Furthermore, as it is a simple analytical tool, trend graphs can become a great ally in different data analyses that you can carry out.
For example, let’s look at the image below.
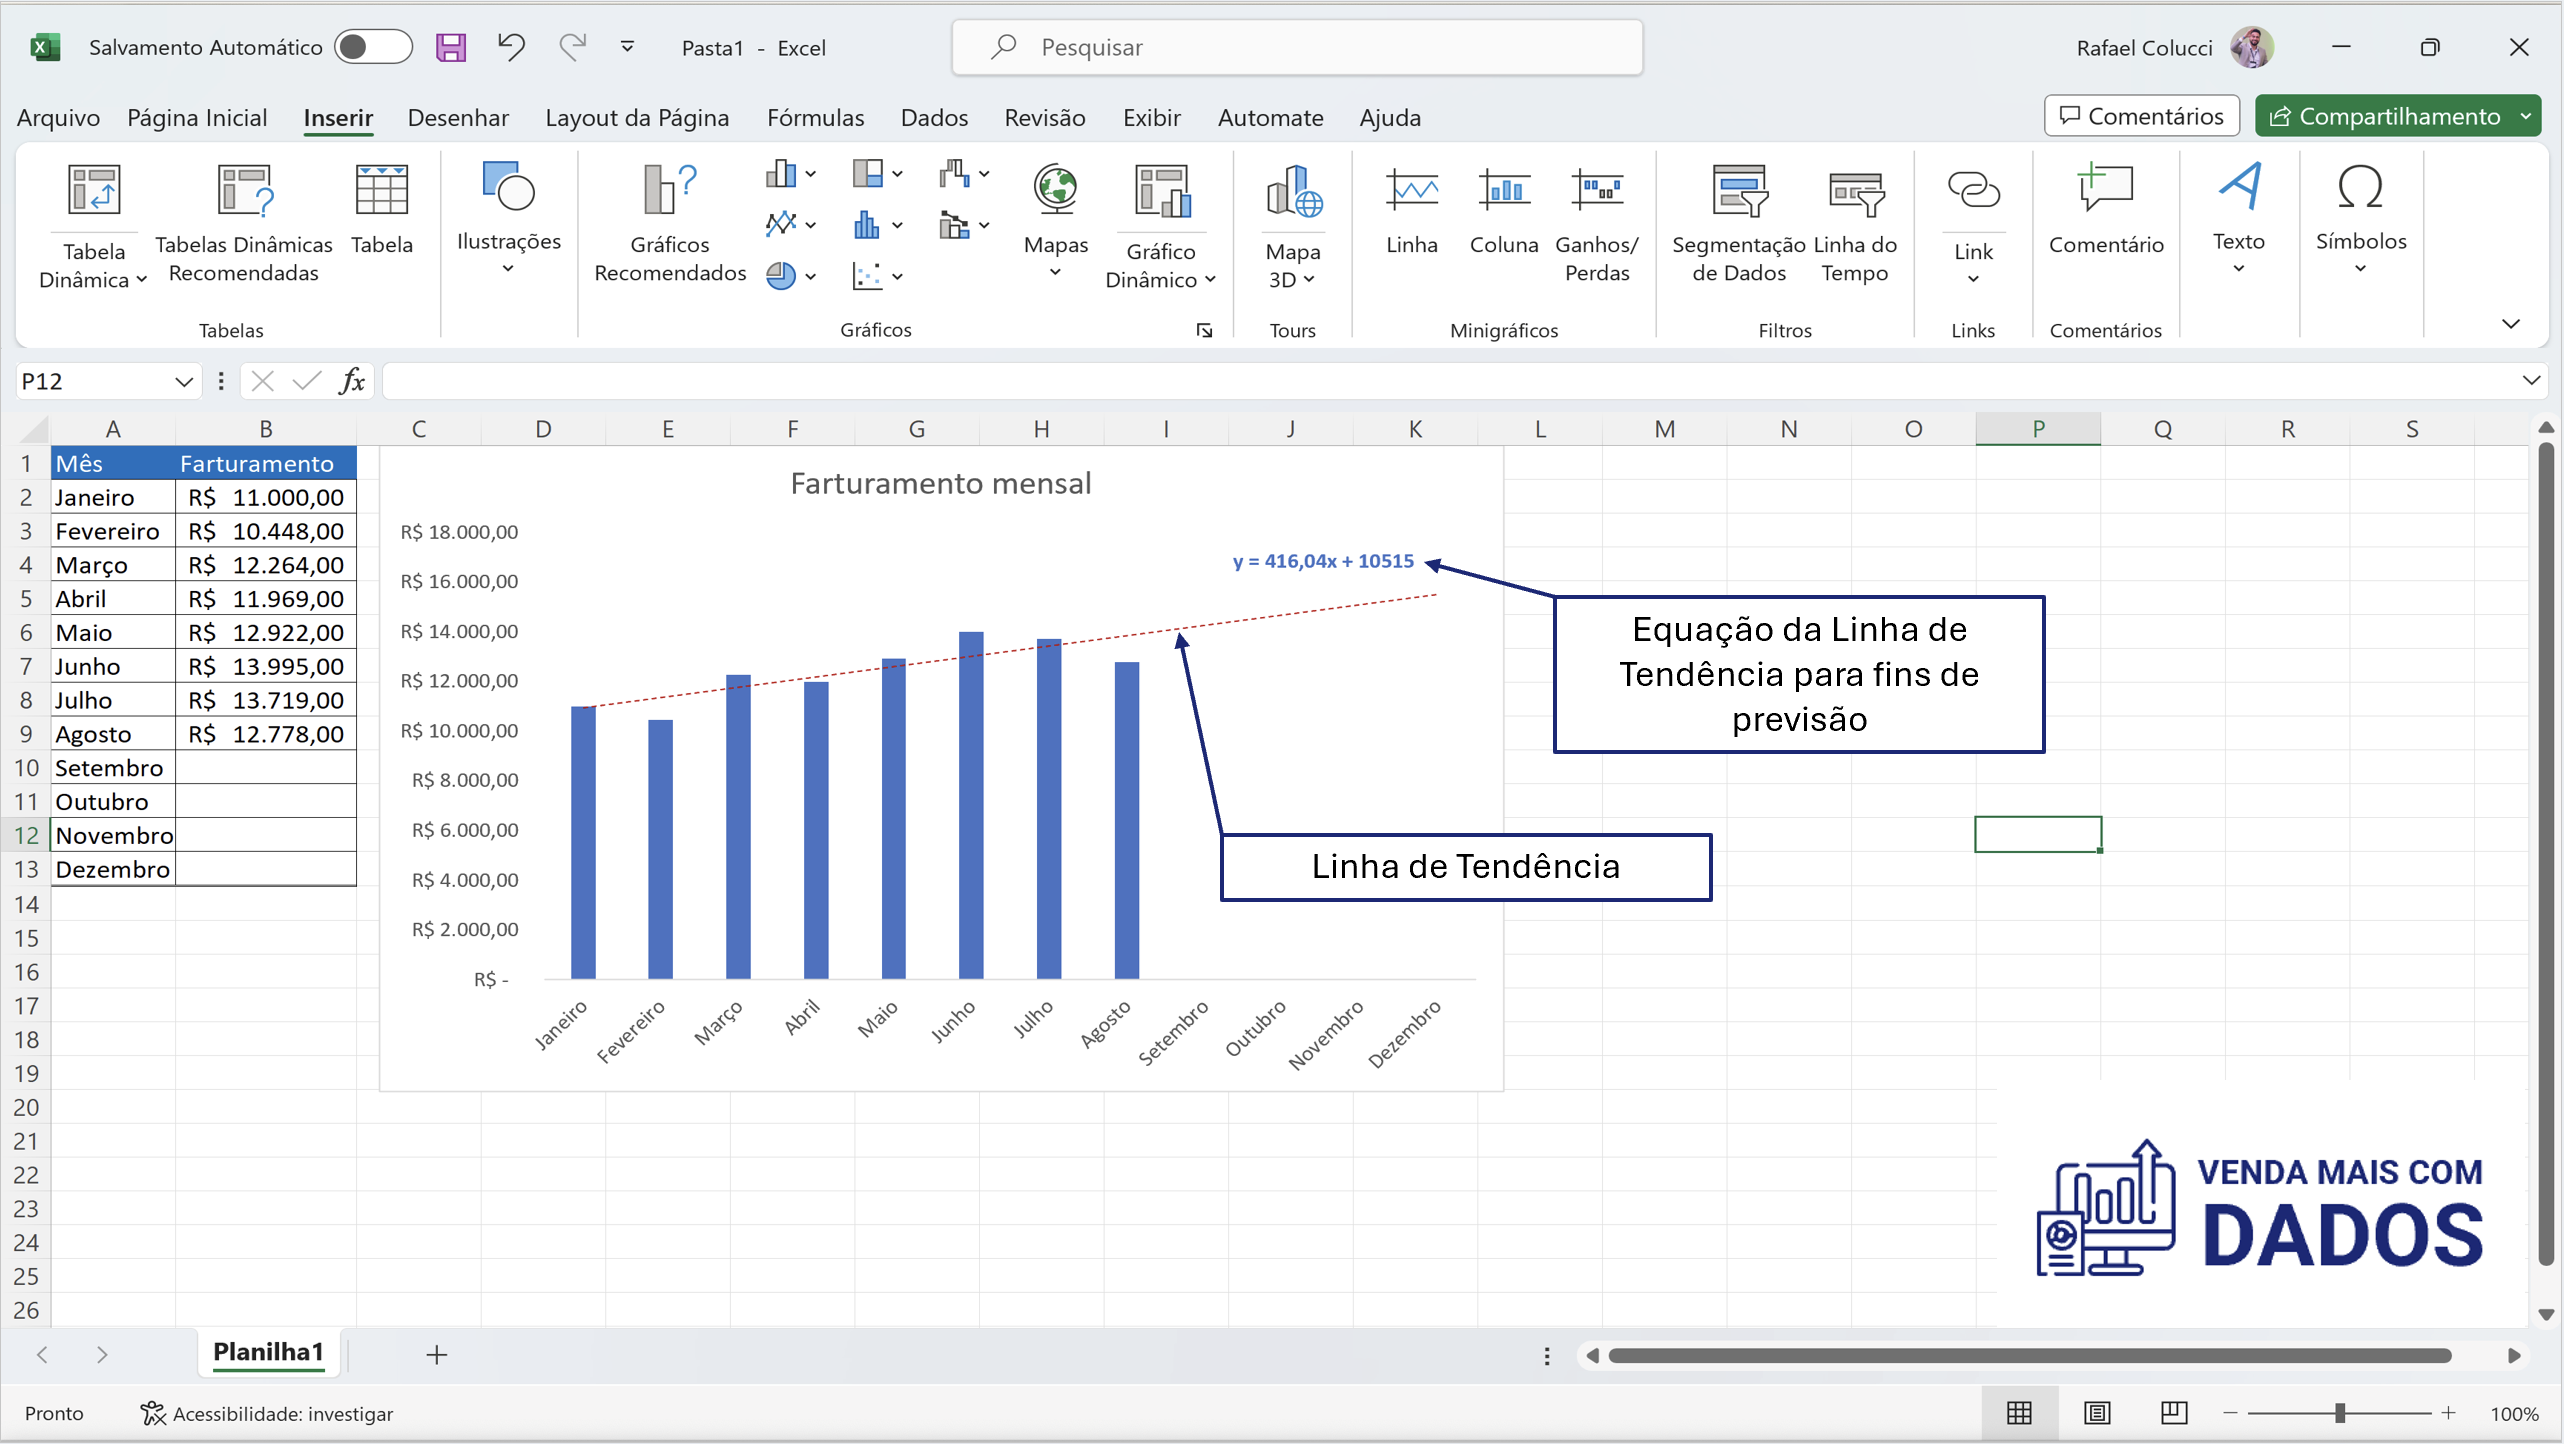
Elements of a Trend line in Excel
Firstly, we noticed that the spreadsheet was not filled out.
Since we still do not have the values for the final months, we can use the Trend Line for forecasting.
Next, the Trend Line visually helps us understand our sales behaviors.
For example, we can use the Trend Line Equation to create a formula in Excel and predict the values for September, October, November, and December.
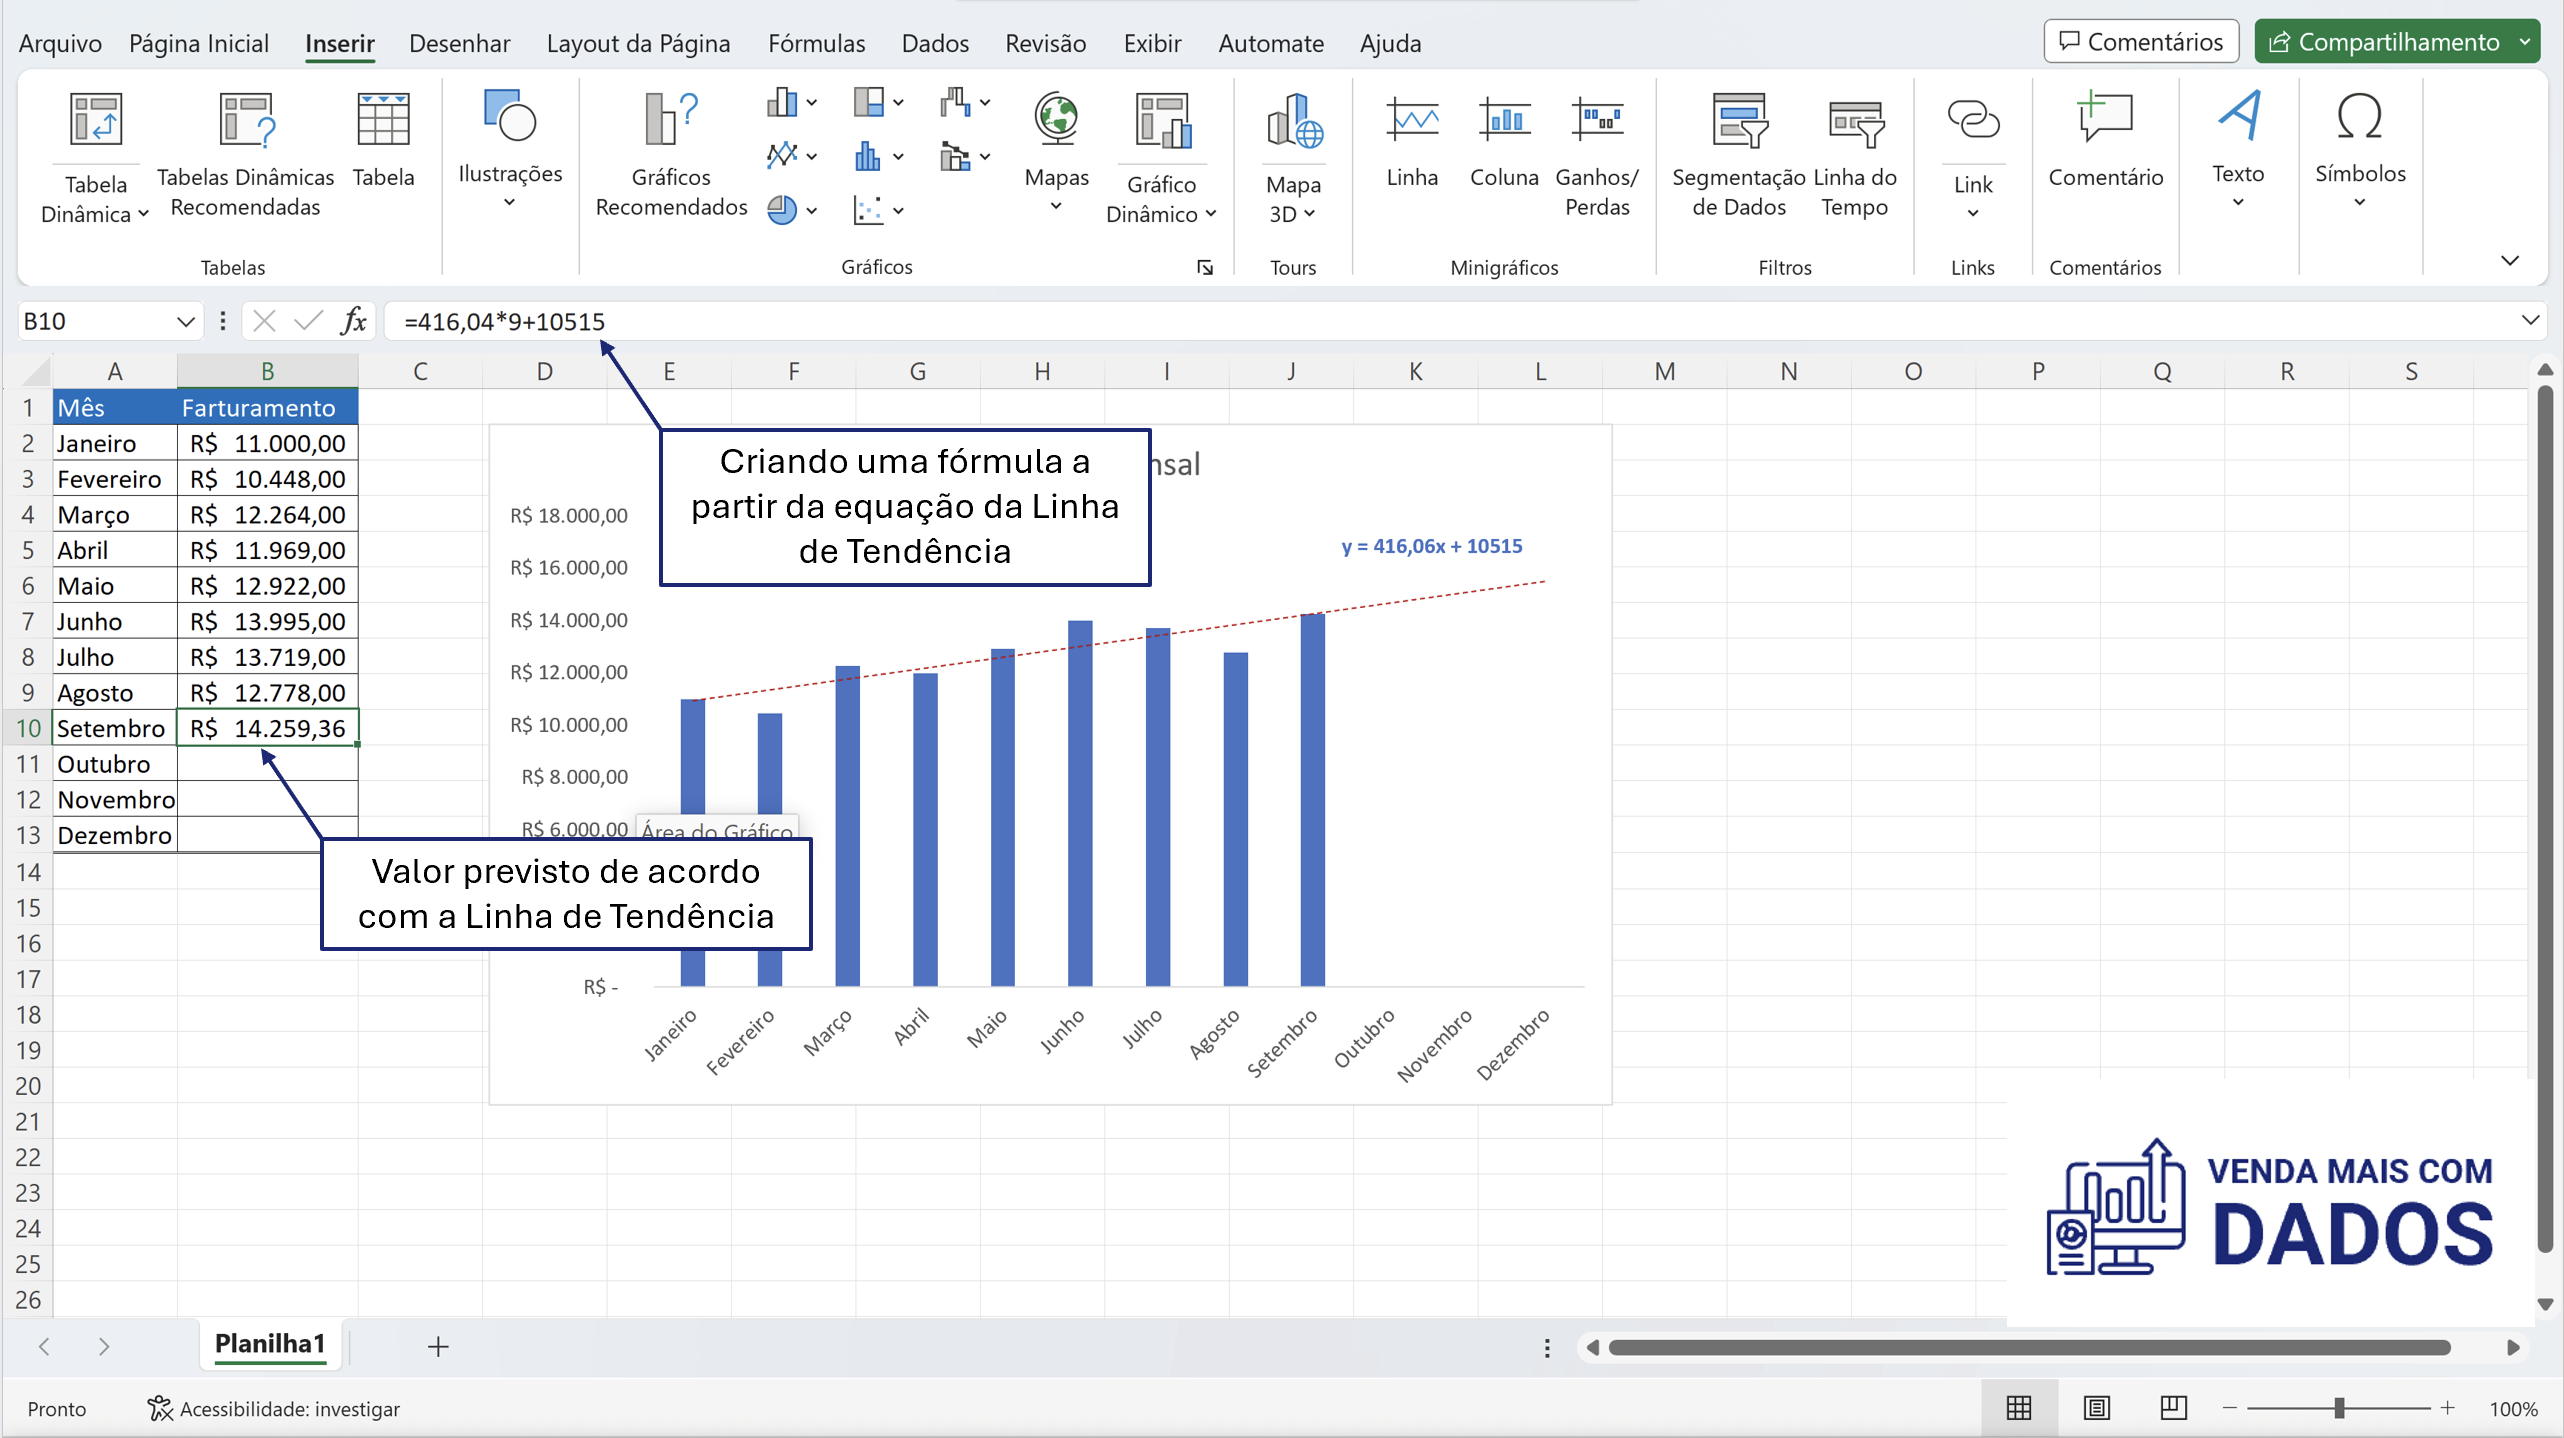
Using the Trend line solution for sales optimization
Therefore, knowing this simple Excel feature is essential to maximize sales through quick data analysis.
Furthermore, for more complex databases, it is possible to use Machine Learning for prediction.
So that you can learn more about the subject, we suggest reading the article on our blog, Machine Learning Applied in Sales – Prediction and Forecast.
Let’s now learn about an important tool to help you define customer segmentation strategies.
Use graphics to better segment your customers.
Customer segmentation has become a fundamental tool for companies that want to develop solid commercial strategies.
Otherwise, it becomes practically impossible for you to understand, anticipate, and satisfy your customers’ needs.
Gartner suggests the framework below for customer segmentation and considers brand affinity and profitability, separating them into low and high.
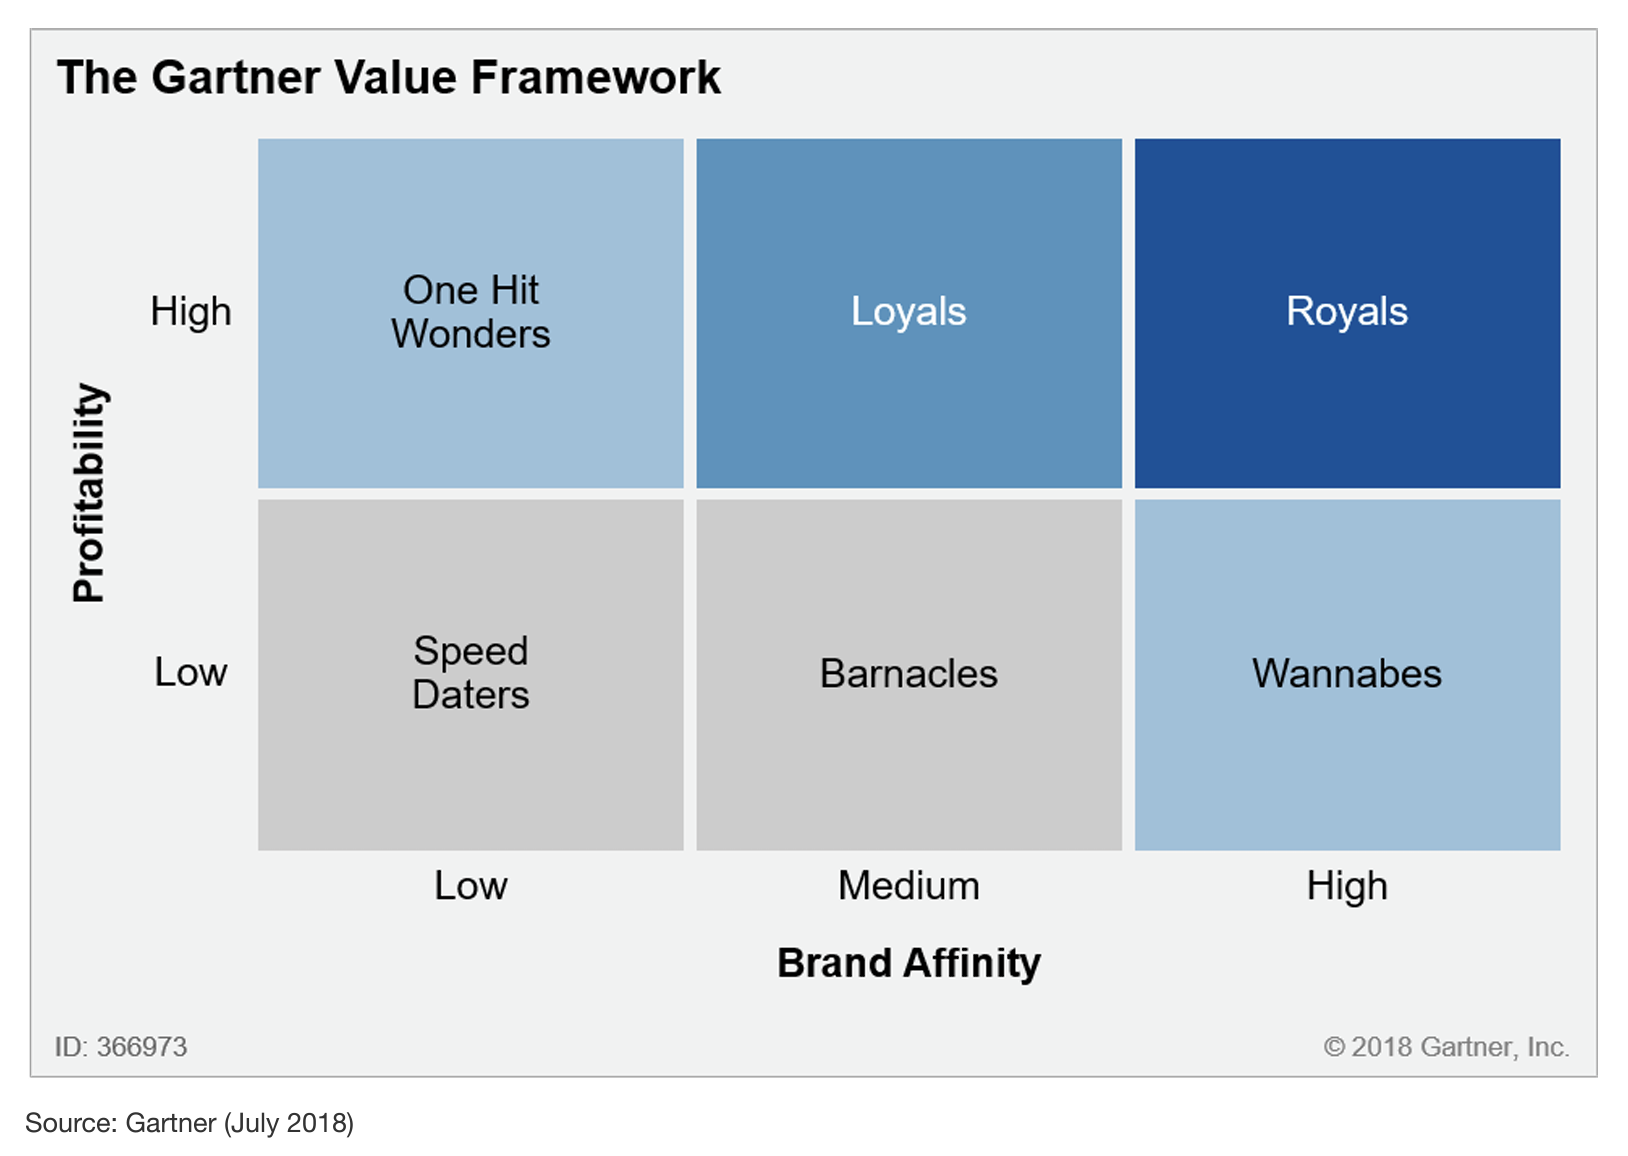
Framework suggested by Gartner for Customer Segmentation
As we can see, it separates customers into six large groups, which can help you define conversion and customer relationship strategies.
For example, what actions can you take to strengthen your relationships with loyal customers?
Similarly, what can you define as a strategy to increase revenue from the group that has a great affinity with your brand but buys little?
Now we will get to know our last, but not least important, chart, the Sales Funnel.
Build your sales funnel quickly and maximize your sales.
In advance, building a sales funnel is very simple and will depend more on the quality of your data than on the tool used.
Therefore, you must understand the sales funnel concept and organize your data to facilitate the process.
For example, Salesforce defines the concept of a sales funnel as representing the entire process of closing a deal.
Sales Funnel according to the Sales Force
Its construction is defined from the moment of capture until the final conversion and represents the stages of the consumer’s purchasing journey.
Another interesting reference is from Zendesk, which comments on the importance of structuring different sales funnels.
This strategy can help you draw up plans with greater assertiveness for each stage of interaction with the customer.
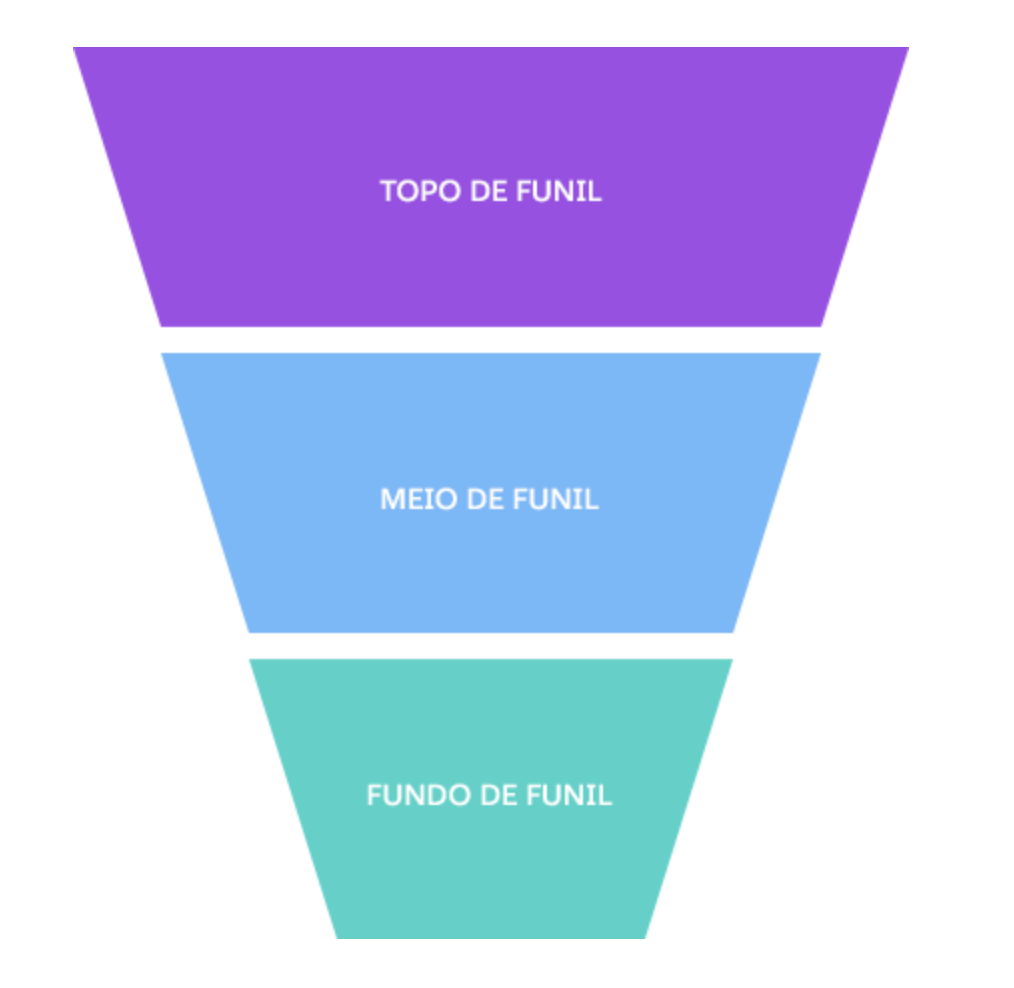
Below is a simple example of a sales funnel developed in Excel.
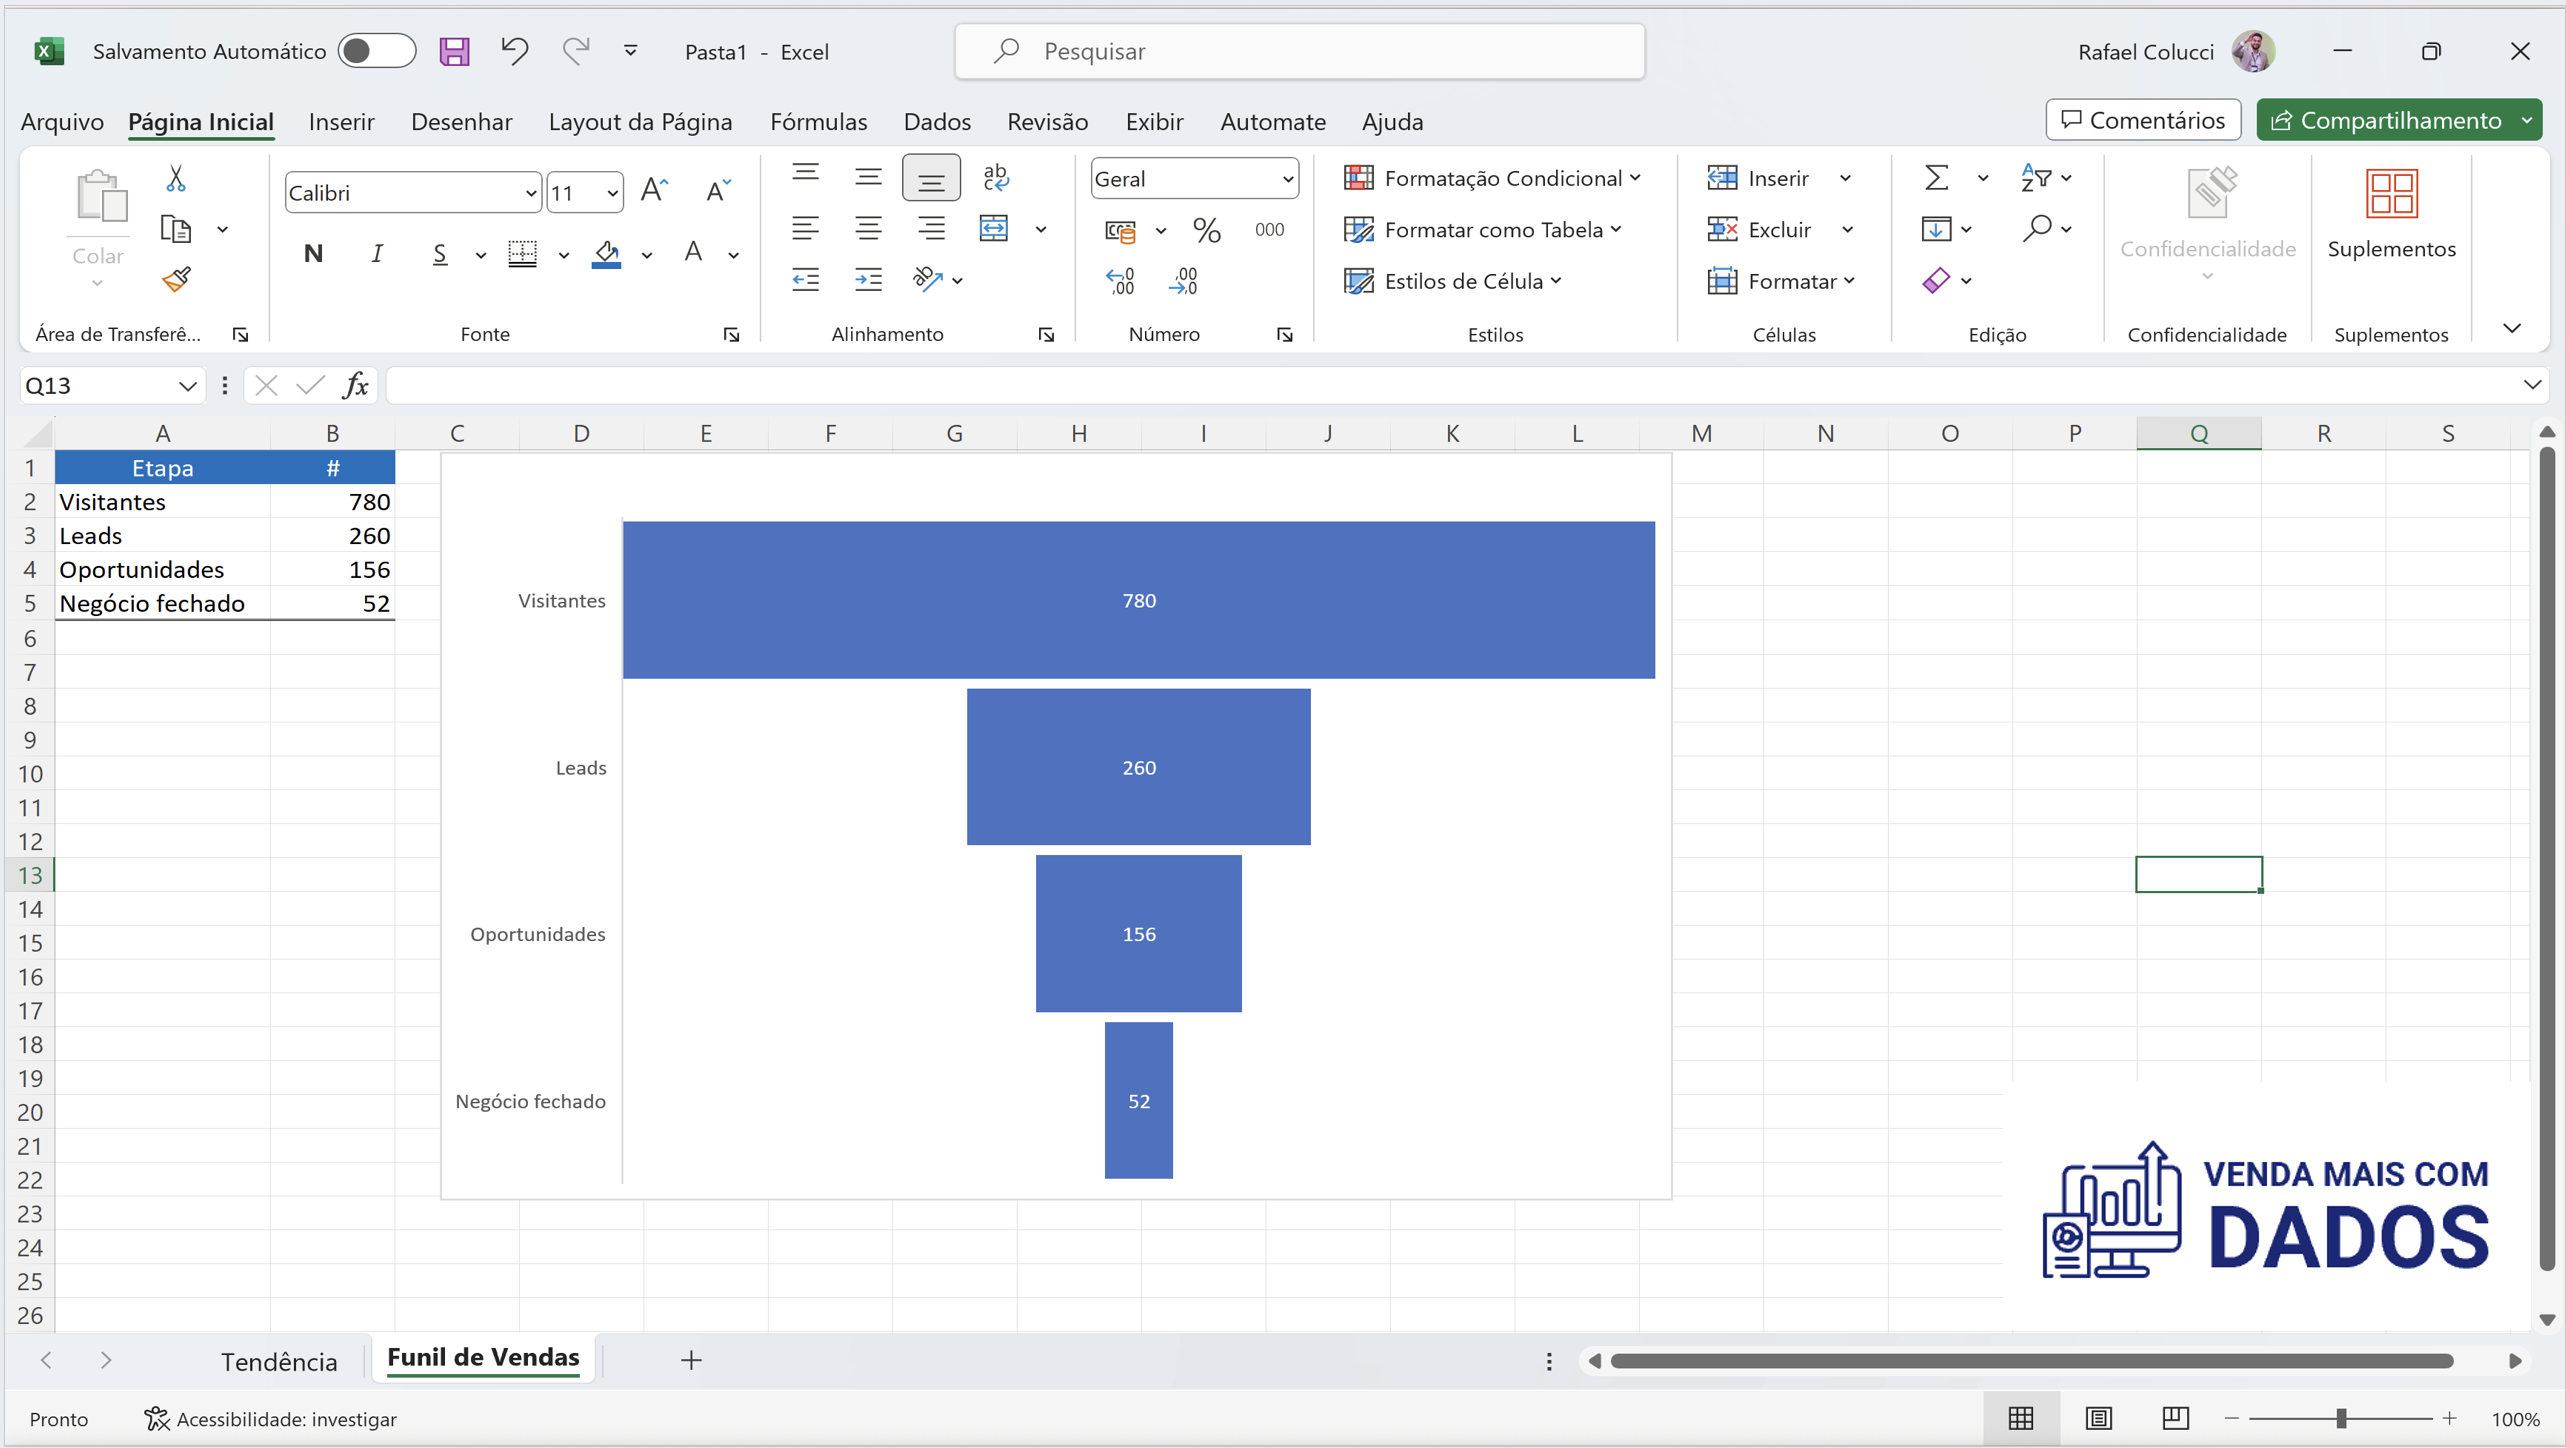
Sales Funnel Example in Excel
Now that we have an example of a sales funnel, we can ask ourselves:
- Is the number of customers who purchased (Closed deal) minor at the top of the funnel?
- Is my lead qualification adequate?
- Have I transformed these leads into business opportunities?
See, more important than building the graph is its use by commercial teams.
Conclusion
As we saw in this article, we can use data visualization to obtain insights that maximize your sales.
Trend Lines, Segmentation Charts, and Sales Funnels help you understand your data and enhance your commercial strategies.
With the abundance of data we have access to today, knowing the resources and analyzing the data is imperative for companies to become successful.
Therefore, we at Venda mais com dados reinforce our commitment to helping you on this journey.
Therefore, we invite you to access our blog’s Insights and Business Intelligence areas.
0 comentários